Syndromic Surveillance Data → State Syndromic Surveillance Systems
State Syndromic Surveillance Systems
Last Updated: August 2022
Several state and local jurisdictions have developed their own syndromic surveillance systems, used separately from NSSP’s BioSense Platform and ESSENCE. Some are also ESSENCE instances developed by the state or local health department, others are home grown or associated with other vendors. Most of those states still contribute data to the NSSP for a more representative national picture and have similar features and local control of development, enhancement and user access of their local system.
As an example of a state system, the Michigan Syndromic Surveillance System (MSSS) user guide, page 30 describes the alerting methodology for MSSS.
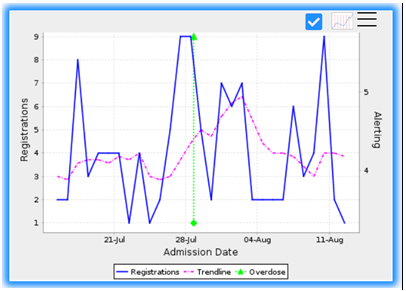
An example of what a syndromic alert might look like (courtesy of the Michigan Syndromic Surveillance System) is below in Figure 1.
The green line, labelled “Overdose” in the legend, corresponds to the date at which the alert was sounded along with the proportion of visits indicated in the “Alerting” axis on the right. The Alerting axis displays the proportion of visits at the time the alert was sounded. The left axis, Registrations, corresponds to the blue and dotted purple lines. The blue line is the count of registrations, and the purple is the registration trendline.

Partner Systems/Systems External to the Health Department
Considerations when using Syndromic Surveillance for Detection of Overdose Anomalies
For syndromic data, if alerts are generated based on a statistical criterion, such as 2.5 standard deviations above the weekly mean, the following adjustments may be useful:
Rural areas are likely to generate a high number of alerts since counts (and means) will be low and just a very small number of excess cases will set off an alert. Therefore, setting a minimum number of registrations may be a necessary modification.
- Use an adequate lookback period, such as 84 days, to ensure normal fluctuations do not generate an alert.
- If possible, consider incorporating trends typically seen by day of the week. If weekend counts are normally higher for example, the system should compare a weekend day to past weekend days. Some clinics or hospital departments may close on weekends, and some EDs have reduced weekend/holiday staffing, while for other data sources, weekend counts typically spike; typical data patterns should be considered by system users even if algorithms adjust for them.
- Lags in reporting from a given facility may be of concern. Specifying several days with non-zero registration counts before an alert can be generated can help avoid alerts generated after a “data dump”. Customary reporting lags may allow such adjustment, while the investigator should be aware of temporary or unusual lags.
- Visits can be viewed by hospital location or patient location. Hospital location will track the occurrence of the acute event and may be more helpful for targeting responses with naloxone. Patient location can be an indicator of long-term burden in residents and may help with planning for medication for opiod use disorder (MOUD) or case management.
Note that when syndromic surveillance visits are labeled as an overdose or opioid overdose they should not be interpreted as absolute counts of confirmed events. The visit is labeled as such based on information provided in the chief complaint and diagnosis fields. Variations in data quality can have an impact on trends and counts. If less detail is provided in chief complaint or diagnosis text fields by certain hospitals, for example, fewer visits may be labeled as overdoses. In some cases, where not enough information is available to detect an opioid overdose specifically, a more general query, or all drug overdose, may be a better syndrome definition to monitor.
Drug Overdose Surveillance and Epidemiology (DOSE) System
The CDC Drug Overdose Surveillance and Epidemiology (DOSE) system was developed to analyze data from syndromic surveillance systems to rapidly identify outbreaks and provide situational awareness of changes in drug overdose-related emergency department (ED) visits at the local, state, and regional level. DOSE leverages timely ED syndromic data captured by health departments to gather aggregate data on ED visits involving suspected all drug, all opioid, heroin, and all stimulant overdoses. The DOSE Dashboard and datasets can be viewed in the Toolkit General Resources section.
The DOSE Dashboard and datasets can be viewed in the Toolkit General Resources section.
Aggregate data include demographic characteristics of those who overdosed, such as sex, age, and county of patient residence. Jurisdictions share their data with CDC as frequently as every two weeks either by uploading data using a secure server or allowing DOSE staff access to their data in CDC’s National Syndromic Surveillance Program’s (NSSP) BioSense platform. The number of jurisdictions included in the calculations of monthly and annual percent change estimates in rates will vary over time. Comparisons between jurisdictions should not be made because of variations in data quality, completeness, and reporting across jurisdictions.
Toolkit Resources
Get more insights by using our toolkit resources.
Go to Resources
Glossary
Learn the definition of the key words being used.
Go to Glossary
Thanks
Thank you, to all of our contributors.
View our contributors

the public’s health.
Contact Us
Have any questions or recommendations, you can contact us at overdose@cste.org
